
Microsoft Open-Sources Flint: Making Charts Generated by AI Agents No Longer a Disaster

Microsoft has open-sourced the visual intermediate language Flint, using a human-readable chart specification system to solve the longstanding problems of structural inconsistency and fragmented styling when AI Agents generate charts, freeing LLMs from the task of “drawing” charts.
Microsoft Open-Sources Flint: Giving AI Agents a Pen That Can Actually Draw Good Charts
Developers who have used Agents to generate charts have probably run into this problem: ask GPT-4 or Claude to output an ECharts configuration, and the model produces JSON that is barely runnable syntactically and aesthetically questionable—misaligned axes, clashing colors, overflowing legends, or complete failure when faced with complex nested structures. Charts are a core output for data-analysis Agents, yet mainstream large models have uneven mastery of libraries like D3, Vega-Lite, and ECharts. The more complex the specification, the more likely things break.
Yesterday, Microsoft quietly launched Flint on its Open Source site, a visualization intermediate language designed specifically for AI Agents. The project lives at microsoft.github.io/flint-chart, with code hosted on GitHub under the MIT license. The positioning is clear: enable Agents to generate expressive, visually polished charts using concise, human-readable specifications.
It may seem like a small thing, but the thinking behind it is worth discussing.
What Makes Chart Generation for Agents So Difficult?
First, it helps to clarify the current mainstream approaches to Agent-generated charts.
The first approach is to have the model directly output Python code and run it in a sandbox with matplotlib or plotly. The problem is that execution environments are heavy, dependencies are numerous, and the likelihood of failure grows exponentially with the number of lines of code. Models also frequently generate results that “work but look bad.”
The second approach is to have the model output JSON specs for mature charting libraries such as Vega-Lite or ECharts options. This is somewhat more stable, but these specifications were designed for engineers, with deep fields, heavy nesting, and significant semantic ambiguity. Models either fail to remember obscure fields or get lost in the interplay between encoding and mark configurations.
The third approach is end-to-end natural-language-to-chart generation, like the chart generation inside Copilot. The user experience is smooth, but the underlying implementation is effectively a black box. Agent developers don’t get access to the abstraction layer and can’t orchestrate it further.
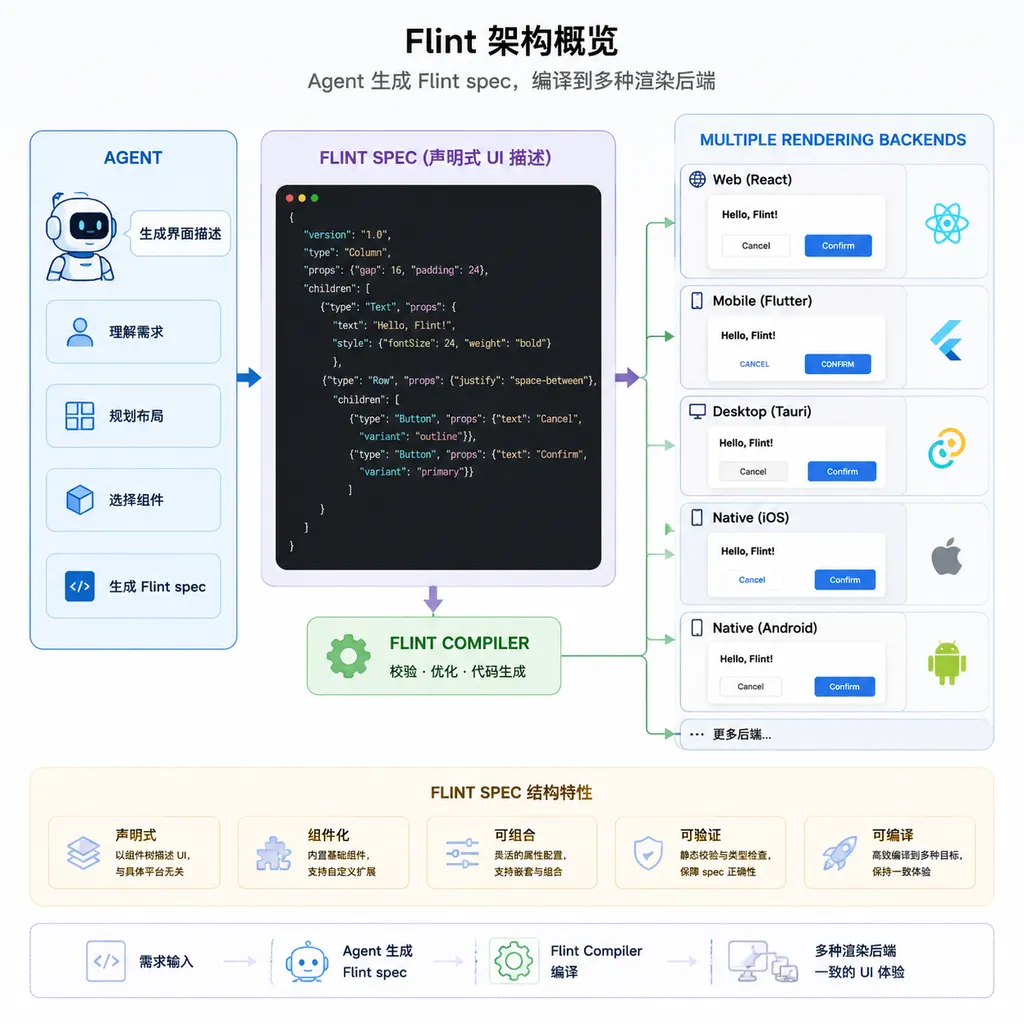
Flint aims to solve the pain points of the second approach: creating an intermediate layer that is thin enough, semantically clear enough, and still capable of handling complex scenarios. Agents only need to understand the Flint specification to generate charts, while Flint itself compiles the declarative description into specific rendering backends.
What Exactly Is Flint?
Officially, Flint is defined as a “visualization intermediate language”—note the word “intermediate.” It is not another Vega-Lite competitor, but rather a deliberately placed layer between LLMs and rendering engines.
There are several key design trade-offs:
1. Human Editability Comes First
Flint specs are designed to be instantly understandable and manually editable. On the surface this looks like a readability concern, but it actually serves Agents directly: the closer a model’s token distribution is to natural language habits, the lower the error rate. In contrast, Vega-Lite-style syntax such as mark: {type: 'bar', ...} combined with a large set of encoding channels is effectively arcane jargon that models must memorize mechanically.
2. Upward-Compatible Expressiveness
Simple scenarios should remain simple, while complex scenarios should not lose expressive power. This is an old challenge in DSL design, but it is especially important for AI generation: if an Agent has to abandon Flint and fall back to native Vega whenever things become complex, the intermediate layer loses its purpose.
3. Reliability First
The official wording is “reliably create expressive, good-looking charts.” In practice, this means default styles should already look good, omitted parameters should remain safe, and there should be fallback handling when errors occur. This is essential for Agent scenarios—no one wants users to see axis labels piled into an unreadable mess.
A Hypothetical Flint Spec
Although the official documentation is still relatively brief, examples suggest Flint strongly favors a declarative and flattened style. Something roughly like this:
chart: bar
title: Revenue by Product Line, Q2 2026
data: sales_q2
x: product
y: revenue
color: region
style: minimal
Compare this with the nested mark, encoding, field, and type structures required for the same effect in Vega-Lite. Flint’s expression is much closer to how people naturally describe charts: “draw a bar chart, product on the X-axis, revenue on the Y-axis, colored by region.”
This design is especially friendly to few-shot prompting. Models can generalize after seeing just a few examples, without needing a huge schema explanation embedded in the system prompt.
Why Microsoft, and Why Now?
Flint makes more sense when viewed in the context of Microsoft’s broader Agent strategy.
Over the past six months, Microsoft has moved aggressively in the Agent space: Agent 365 was introduced at RSAC 2026 as an enterprise Agent control plane, Azure AI Foundry was positioned at Build 2025 as an Agent orchestration platform, and Copilot Studio emphasizes multi-Agent collaboration. These are all investments in orchestration, governance, and security layers.
But when Agents are deployed into actual business workflows, one output format becomes unavoidable: charts. BI, financial reports, data analysis, monitoring alerts, operational reviews—any data-centric Agent ultimately needs to visualize information. Flint fills this gap: the final-mile visualization layer for Agent-generated output.
An even subtler point is that Flint is an intermediate language, which means it can naturally connect to different rendering backends. Today it might compile to ECharts; tomorrow it could compile to Power BI components; later it could render directly into adaptive cards inside Teams. Microsoft is aiming for Flint to become the default protocol for Agent-generated charts, not just another frontend charting library.
The ambition resembles the path taken by LSP (Language Server Protocol). LSP decoupled editors from language services; Flint aims to decouple Agents from rendering engines.
Compared with Vega-Lite and GPT-Vis, Where Does Flint Fit?
Several comparisons are unavoidable:
Vega-Lite: A long-established high-level grammar from the academic visualization world, highly expressive but unfriendly to LLMs. Its field naming and hierarchy were designed for visualization researchers. Flint clearly operates at a higher level of abstraction, sacrificing some low-level control in exchange for generation reliability.
GPT-Vis / AntV: Ant Group’s open-source Agent charting solution follows a similar idea: an LLM-friendly chart DSL plus multi-backend rendering. Flint will likely compete directly with GPT-Vis, with success depending on ecosystem growth and model-side support.
Direct Chart.js / ECharts generation: Having models write raw library configurations is simple and brute-force, but also the least reliable approach. Flint is explicitly trying to eliminate this pattern.
From a technical perspective, public information about Flint is still limited. Details about syntax, extension mechanisms, and support for advanced chart types such as Sankey diagrams, geographic visualizations, and hybrid coordinate systems will require future documentation. But the direction is correct: visualization infrastructure in the AI era must treat LLMs as first-class citizens.
What This Means for Agent Developers
If you’re building data-oriented Agents, Flint is worth watching for several reasons:
- Prompt costs will decrease. Using Flint as the output format significantly reduces the amount of schema explanation needed in system prompts, and few-shot examples become shorter as well, directly saving tokens.
- Multi-model compatibility improves. The same Flint spec can be generated by GPT-4, Claude, Gemini, or DeepSeek without tuning prompts separately for each model. This matters greatly for multi-model routing scenarios—for example, when using aggregation platforms like OpenAI Hub to compare Claude 3.7 and GPT-5 side by side. Flint ensures consistent output formatting, making evaluation easier.
- Rendering-layer decisions can be deferred. Which charting library the frontend uses, whether interactivity is supported, or whether PDF export is needed can all be decided at compile time, without the Agent layer needing to care.
For enterprise scenarios, an even more practical benefit is that chart output can undergo strict schema validation. A validator can check Agent-generated Flint specs, retrying or degrading gracefully when they fail validation—far more reliable than post-processing raw ECharts JSON.
Some Reservations
That said, Flint is still very early-stage. There are several concerns.
First, intermediate languages often suffer from being “not good enough for either side”—less expressive than native libraries, yet more cumbersome than high-level APIs. Whether Flint can maintain the right balance depends on future iterations.
Second, ecosystem is a hard barrier. Vega-Lite has backing from the D3 academic ecosystem, while ECharts is supported by the Apache Foundation and broad industry usage in China. Right now Flint is primarily driven by Microsoft itself. Whether it can attract the community to build extensions, plugins, and adapters will determine how far it can go.
Third, there’s the pace of integration within Microsoft’s own product lines. If charting capabilities in Power BI, Fabric, and Copilot Studio do not migrate to Flint in the near term, the project risks looking more like an open-sourced internal proof of concept, weakening its credibility.
Still, the fact that Microsoft is willing to open-source this protocol layer is itself a signal: in the Agent era, the software stack is being restructured, and even specialized areas like charting are having their abstraction layers redefined. Infrastructure-level projects like this are worth following closely.
The project repository is already live on GitHub, and interested developers can explore examples and spec definitions directly. It is still in the early stages, with PRs and issues actively being handled.
References
- microsoft/flint-chart on GitHub - Flint project source code and documentation, including complete spec definitions and examples