Armature Sets Its Sights on the Agent Session Black Box
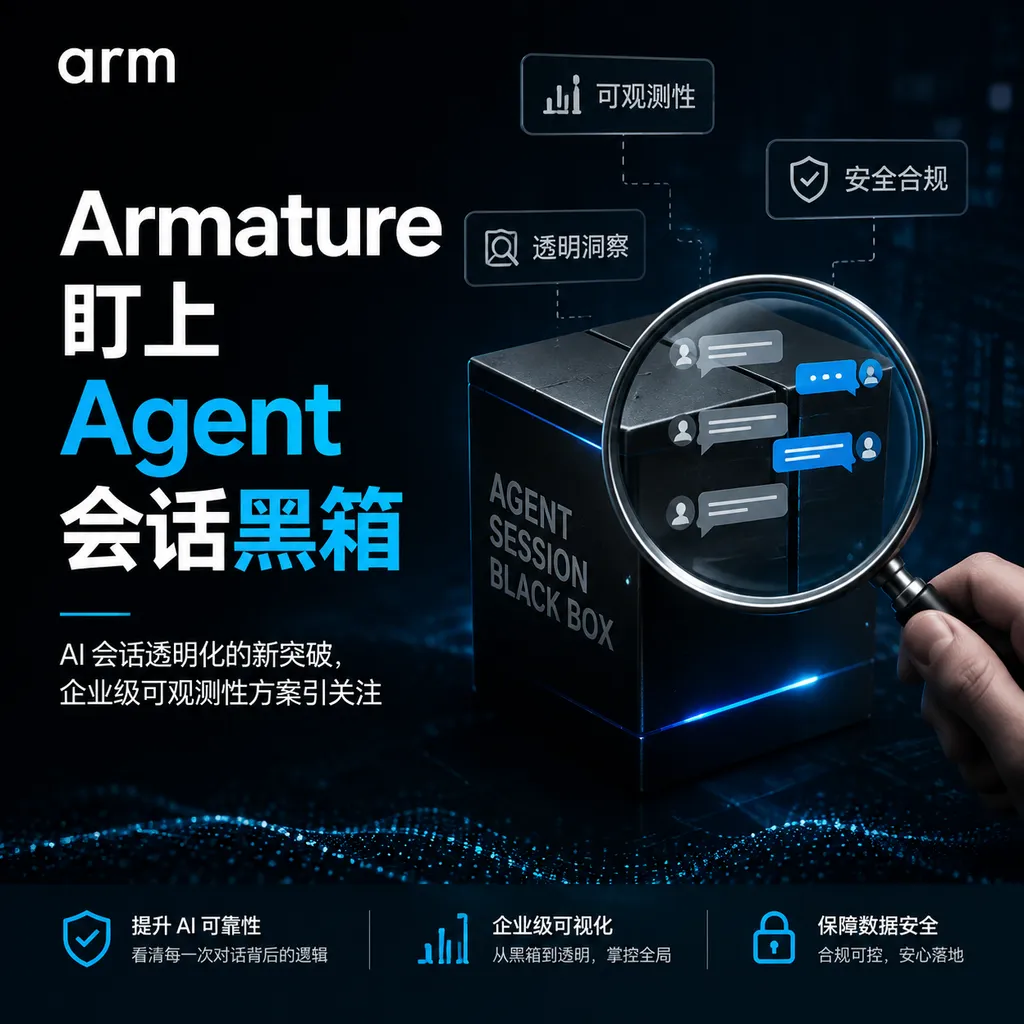
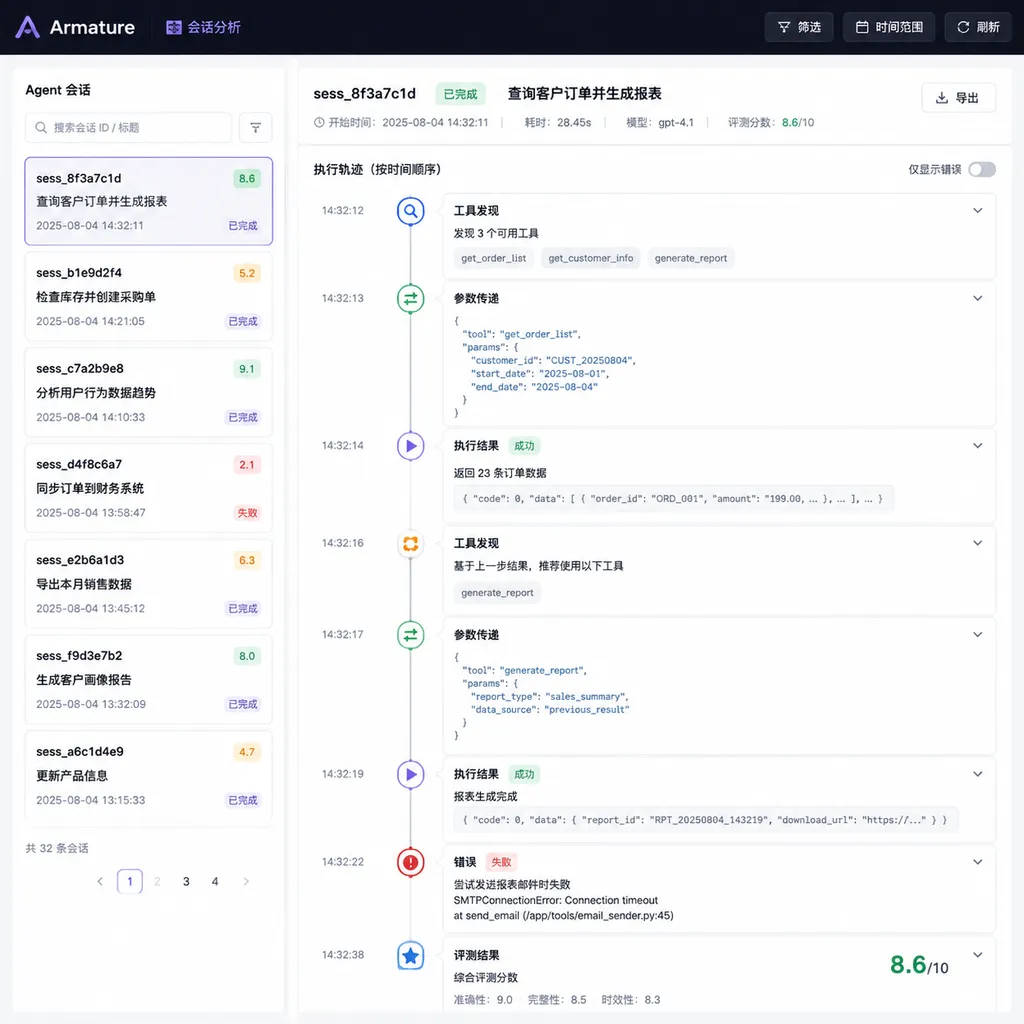
Armature recently launched a session analysis and evaluation tool for MCP that reconstructs complete agent execution traces from fragmented tool calls. Rather than merely checking whether interfaces work, it helps explain why an agent chooses the wrong tool, gets stuck in a loop, and how well a task was ultimately completed.
Armature Sets Its Sights on the Agent Session Black Box
Armature recently launched an Agent session analytics and evaluation tool for MCP, aiming to pull developers out of fragmented logs. Instead of merely checking whether a particular tool call returned a 200 status code, it follows an entire session to examine which tools the Agent called, in what order, where failures occurred, and whether it ultimately completed the task assigned by the user.
As of August 3, 2026, Armature has emphasized its core positioning as “product analytics and evaluation running on top of your MCP.” Based on currently available information, it remains a relatively early-stage developer tool, with its integration methods, deployment options, pricing, and enterprise capabilities yet to be fully developed. But it has identified the right problem: MCP addresses how Agents connect to tools, but it does not automatically solve how developers understand Agents.
These two concerns may appear adjacent, but in practice, an entire observability infrastructure lies between them.
MCP Standardized the Interface, but Not the Answer
MCP is often compared to USB-C for AI applications: models or Agents can discover tools, read resources, and call external services through a standard protocol, without requiring a separate proprietary integration for GitHub, databases, search engines, and internal enterprise systems.
That analogy is only half right.
USB-C can ensure that a device plugs in, but it cannot ensure that an application selects the right device. MCP is the same: it standardizes how tools are described, discovered, and invoked, but when an Agent is presented with dozens of similarly named tools, the truly difficult questions are only beginning:
- Why did the Agent choose search instead of a structured database query?
- It called the correct tool, so why were parameters still missing or of the wrong type?
- If it called the same tool five times in a row, was that reasonable retry behavior, or was it stuck in a loop?
- The final answer appears correct, but did the Agent make unnecessary, expensive calls along the way?
- After changing the model, prompt, or tool description, did the completion rate actually improve, or did performance only look better in a few demos?
Traditional application observability generally focuses on requests, services, and infrastructure. HTTP status codes, latency, exception stacks, and CPU utilization are all important, but they struggle to answer the question: “Why did the Agent take this path?”
For example, a weather query tool may return a 200 status code with perfectly formatted parameters, but the Agent queried Shanghai when the user asked about Shenzhen. From a service monitoring perspective, the call succeeded; from a task perspective, it had already failed.
Armature is designed to bridge precisely this semantic gap.
Its Unit of Analysis Is Not the Request, but the Session
Based on Armature’s current public positioning, it is not merely another API request dashboard. Instead, it treats the “Agent session” as the unit of analysis and evaluation.
A single Agent session often includes user input, model planning, multiple rounds of tool discovery and invocation, error recovery, and result synthesis. Looking at only one log entry is like seeing a single frame from the middle of a movie: the image may be clear, but you have no idea why the story arrived at that point.
By organizing data around sessions, developers can understand Agent behavior at no fewer than three levels.
Level One: Tool Invocation Facts
This is the most basic level, covering which MCP tools the Agent discovered, which one it ultimately selected, what parameters it passed, what results the tool returned, how long the call took, and what errors occurred.
It can quickly expose engineering issues such as missing parameters, schema mismatches, permission failures, and tool timeouts. In the past, this information was usually scattered across logs from the model service, Agent framework, and MCP Server, requiring developers to manually correlate timestamps and session IDs during troubleshooting.
Level Two: The Complete Execution Trace
A correct individual call does not mean the overall path was reasonable. A session-level trace focuses more on the relationships between tool calls. For example:
- The Agent first called the wrong tool;
- After receiving an error, it replanned;
- It switched to another tool but reused the old parameters;
- After failing again, it repeated the first step;
- Finally, after reaching the step limit, it generated an answer that appeared plausible but lacked supporting evidence.
Without a trace view, this type of issue is often dismissed as “occasional model instability.” Once the call sequence is laid out, developers can determine whether the root cause is insufficient model capability, ambiguous tool descriptions, overly burdensome parameter design, or error messages that fail to provide actionable feedback for recovery.
Level Three: Evaluation and Product Analytics
Armature’s decision to combine analytics and evals is one of the more noteworthy aspects of its product positioning.
Evaluation should not happen only before launch. Agents face constantly changing user inputs, tool states, and external data, making it difficult for offline datasets to cover the long-tail paths encountered in production. Session analytics provides real-world samples, while evaluation turns those samples into comparable metrics.
An evaluation framework for MCP sessions generally needs to answer all of the following:
- Task completion: Was the user’s request actually completed?
- Tool selection accuracy: Did the Agent choose the appropriate tool?
- Parameter validity: Did the input comply with the schema and business constraints?
- Path efficiency: Were there pointless calls, duplicate queries, or excessive retries?
- Recovery capability: Could the Agent adjust its strategy based on error messages after a tool failed?
- Cost performance: How many model tokens, tool calls, and how much total time were required to complete a task?
- Security boundaries: Did the Agent invoke unnecessary high-privilege tools or trigger unconfirmed write operations?
This is closer to the true quality of an Agent than simply applying LLM-as-a-Judge to the final answer. Two Agents may produce the same final answer while taking completely different execution paths: one calls two tools and obtains a reliable result, while the other makes fifteen calls, encounters three permission errors, and happens to arrive at the correct answer. To users, both may temporarily appear “usable,” but in production they are not the same kind of product.
“Actual Execution Process” Does Not Mean Reading the Model’s Mind
A boundary must be drawn here: the “actual execution process” that Armature can observe primarily consists of the Agent’s external behavior and session events, not the model’s invisible internal reasoning state, much less any supposed hidden chain of thought.
What developers truly need is generally not the full chain of thought, but verifiable behavioral evidence:
- Which tool definitions the model saw;
- Which tool it selected;
- What parameters it generated;
- What the tool returned;
- What action the Agent took next;
- Whether the final result is supported by the preceding evidence.
This behavioral trace is more suitable for debugging than a lengthy natural-language “thought process,” and it is also easier to audit. A model may claim in its explanation that it performed a check, but tool invocation records do not lie.
Armature’s value, therefore, is not that it makes Agents completely transparent, but that it ensures these otherwise uncontrollable probabilistic systems leave behind enough verifiable evidence.
Why General-Purpose Tracing Is Not Enough
The Agent observability market is not empty. LangSmith, Langfuse, Arize Phoenix, and internal systems built on OpenTelemetry can already record model calls, spans, tokens, and latency. Some cloud monitoring products have also begun tracing MCP requests.
For Armature to justify its existence, it cannot simply recreate these capabilities. It must demonstrate that an MCP-native perspective provides additional value.
General-purpose tracing is more like vital-sign monitoring in a hospital: it tells you which service is slow, where an error occurred, and how much a request cost. MCP session analytics is more like reviewing a doctor’s complete diagnostic and treatment process: why a particular test was ordered first, why another tool was not used, how the approach changed after a test failed, and whether the final conclusion was supported by evidence.
The two are not in conflict. Ideally, products like Armature would handle behavioral semantics and session evaluation, while underlying tracing systems would continue to manage infrastructure metrics and cross-service traces. The real challenge is reliably correlating the two datasets, including session IDs, model requests, MCP tool calls, and backend service spans.
If Armature can do no more than display attractive call timelines, it could easily become merely a more specialized log viewer. Only if it can build datasets, regression tests, version comparisons, and production alerts around real sessions will it have a chance to become quality infrastructure for Agent teams.
These Tools Are Most Useful for Improving Tools, Not Prompts
When an Agent runs into problems, a team’s first reaction is usually to keep tuning the prompt. But in MCP scenarios, many failures are not caused by the prompt itself. Instead, the tool interface may be unfriendly to the model.
From the model’s perspective, a tool is primarily defined by its name, description, and input schema. No matter how elegantly the implementation code is written, an Agent will still be prone to misuse the tool if its description is ambiguous, it has too many parameters, or its error responses are unreadable.
Session analytics can help developers identify which tools should be redesigned. For example:
- Two tools have similar names, causing a persistently high rate of incorrect selection;
- A required parameter is frequently missing, suggesting that it should be inferred server-side or given a default value;
- A tool returns excessively long content, consuming context and triggering downstream errors;
- An error message says only “Invalid request,” preventing the model from correcting its parameters;
- Read-only queries and write operations are combined in the same tool, increasing the risk of unintended actions;
- The Agent frequently switches back and forth between two tools, exposing overlapping capability boundaries.
This is also what makes Armature different from ordinary product analytics. Traditional product analytics studies how people click through interfaces; Agent product analytics studies how models use tools. The former optimizes buttons, funnels, and retention, while the latter optimizes names, descriptions, schemas, permissions, and feedback mechanisms.
The Real Challenge in Evaluation Is Defining “Good”
Armature is right to place product analytics and evals within the same product narrative, but implementation will not be easy.
Agent tasks often have no single correct path. If a user asks an Agent to organize a business trip, it may be reasonable to search for flights first or hotels first. Making three search calls is not necessarily worse than making one, because different searches may provide additional evidence. A system cannot simply define “fewer calls” as “better performance.”
Reliable evaluation requires multiple layers:
- Deterministic rules are suitable for checking parameter formats, call loops, permission violations, and strict business constraints;
- Reference traces are suitable for verifying that key steps occurred, but should not require the exact same execution order;
- Model judges are suitable for assessing answer quality and semantic completion, but bias and drift must be controlled;
- Human review is suitable for high-risk tasks and edge cases, and can in turn be used to calibrate automated evaluations.
More importantly, evaluation results must support slicing. A two-percent increase in an overall score offers almost no actionable guidance. Developers need to know which model, which tool, which type of user task, and which Agent version drove the change.
If Armature can eventually turn production sessions into regression samples with one click and support comparisons across models, prompts, tool schemas, and Agent orchestration versions, it will be much more useful than a simple “session replay.”
Data and Permissions Are Unavoidable Challenges
Observing MCP sessions may involve access to tool parameters, enterprise data, user inputs, and execution results, potentially including code, customer information, database queries, and even credentials for write operations.
As a result, enterprises considering this type of tool will look beyond the dashboard and ask:
- Can data be self-hosted or processed within the customer’s environment?
- Which fields can be collected, and which can be redacted at ingestion?
- Does it support role-based access control and audit logs?
- How long is session data retained, and can it be deleted at a user’s request?
- Will sensitive content in tool responses be sent again to an evaluation model?
- Will production evaluation introduce additional latency and cost?
The answers will determine whether Armature remains a lightweight SaaS product or becomes an observability platform suitable for enterprise production environments. At present, its public information is insufficient to answer these questions, so developers should not send all production traffic to the platform based solely on its product positioning.
A more prudent approach would be to begin with a test environment, redacted traffic, or low-risk read-only tools, verify whether it genuinely shortens troubleshooting time, and only then decide whether to expand coverage.
Our Assessment: The Direction Matters More Than the Product’s Maturity
Armature’s greatest value today is not that it has announced an unprecedented technology, but that it shifts the unit of observation in Agent development from the “model request” to the “task session.” This is an inevitable layer of infrastructure as MCP gradually moves into production environments.
Teams used to ask: Did the model API return an error?
Now they should ask: Did the Agent complete the task in a reasonable way?
The first question can largely be answered with logs and tracing. The second requires session traces, semantic metrics, regression datasets, and production evaluations working together.
Armature has chosen the right problem, but whether the product can establish itself will depend on three capabilities: whether it is easy enough to integrate with different MCP clients and Servers, whether it can transform sessions into actionable evaluation data, and whether it can meet production requirements for privacy, performance, and cost.
In the short term, it is better suited to teams already running MCP Agents and struggling with incorrect tool selection and complex call chains than to developers who have just built their first demo. With only one or two tools, print logs may be enough to solve problems. Once the number of tools reaches the dozens, Agent versions are iterated frequently, and production session volume grows, dedicated session analytics will shift from a “nice-to-have” to a “must-have.”
MCP gives Agents hands and feet. Tools like Armature aim to equip development teams with a dashcam: they cannot guarantee that an Agent will never make a mistake, but they can at least show the team exactly where the accident occurred.
References
- Model Context Protocol Specification: The official open-source MCP repository, useful for understanding the protocol architecture, tool discovery, resources, and message interaction mechanisms.
- MCP Inspector: The official debugging tool for inspecting the tools exposed by an MCP Server, their parameter schemas, and invocation results. It is useful for understanding the difference between basic debugging capabilities and session analytics products.