
Why Do LLMs Struggle with Tabular Prediction?

The latest research once again shows that understanding tables does not necessarily translate into accurate tabular predictions. Serialization, numerical tokenization, and misaligned training objectives often cause general-purpose LLMs to lose to cheaper traditional models on structured tasks.
The recently released preprint paper, “Why Large Language Models Fail at Tabular Prediction,” brings an issue easily obscured by the LLM hype back into focus: Large language models can explain tables, generate SQL, and even make plausible judgments based on a few examples—but once they are used for rigorous tabular prediction, they are often less reliable than expected.
Here, “tabular prediction” does not mean asking a model, “What is this table about?” It means predicting a target value from a set of feature columns. Examples include predicting churn probability from a user’s age, subscription plan, spending over the past three months, and number of complaints, or assessing default risk based on a company’s financial indicators.
These tasks have long been handled by models such as logistic regression, random forests, XGBoost, LightGBM, and CatBoost. They may not be fashionable, but they are inexpensive, stable, and easier to calibrate. Converting the same CSV file into text and feeding it to a general-purpose LLM such as GPT, Claude, or Gemini not only costs more, but may also produce worse results.
This is not simply because the models lack enough parameters, nor is it merely a matter of poorly written prompts. The more fundamental reason is that LLMs learn the patterns of the linguistic world, while tabular prediction requires a different set of inductive biases.
First, Distinguish Between Two Things: Reading Tables and Making Predictions
LLMs perform well in many table-related demonstrations. For example, if you paste a sales table into a chat box and ask the model to summarize anomalous regions, explain what the fields mean, or generate Pandas code, it can usually complete the task because the core capabilities involved are still language understanding and code generation.
Supervised tabular prediction has different requirements. The model must learn stable statistical relationships from a large number of training samples and then generalize to previously unseen data. The evaluation criteria are not whether the answer reads smoothly, but metrics such as AUC, F1, RMSE, calibration error, and stability across time.
Consider a simple example:
- “Users who submit more complaints may be more likely to churn” is a commonsense judgment, something LLMs are very good at;
- “How much does churn probability increase when the number of complaints rises from 2 to 3, the subscription plan is B, and tenure is less than 47 days?” concerns statistical relationships within a specific dataset;
- “When positive samples account for only 0.7% of the data, how many false positives will result from increasing recall to 80%?” requires a complete understanding of the distribution, threshold, and cost function.
An LLM may answer the first type of question very well without truly mastering the latter two. Being able to explain fields is not the same as understanding the joint distribution between those fields and the label.
Once a Table Becomes Text, Its Structure Begins to Disappear
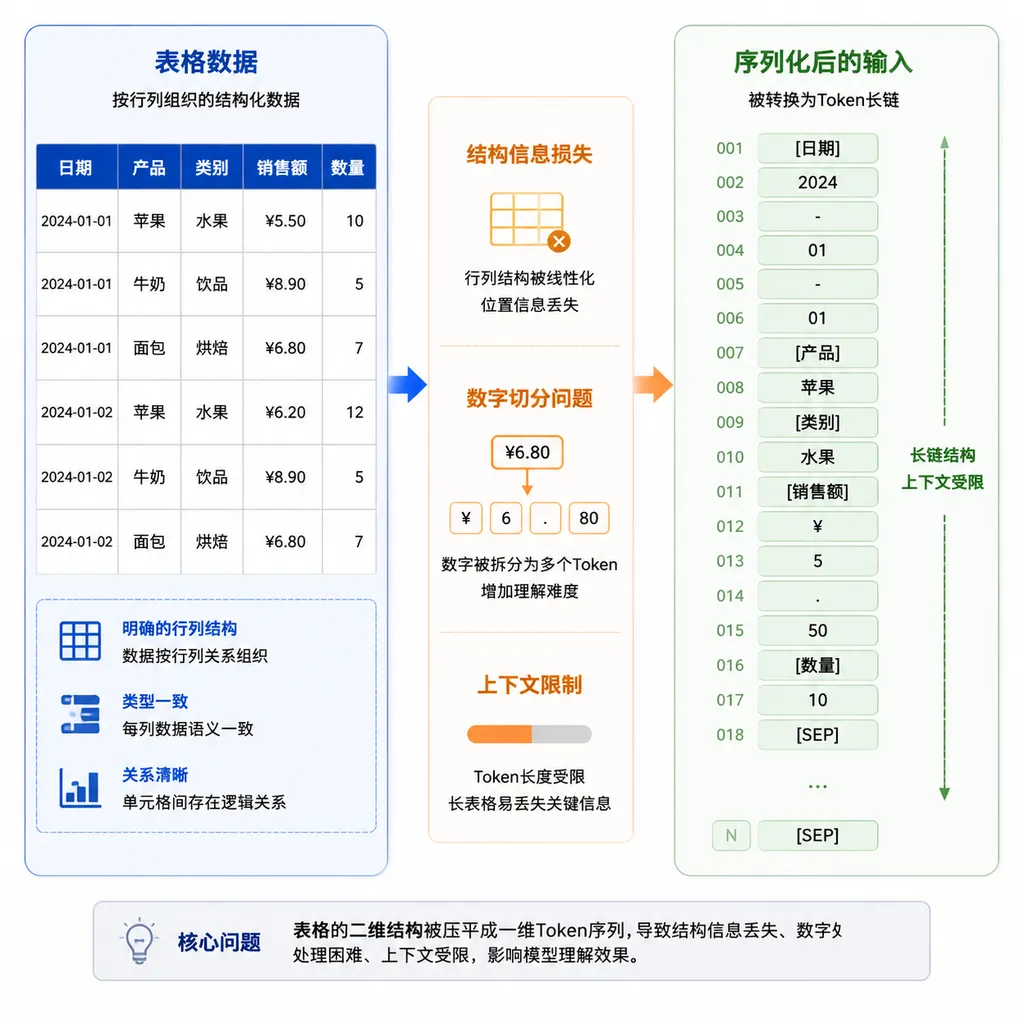
Transformers receive token sequences. To enable an LLM to process a table, developers usually have to serialize the data first—converting it into CSV, Markdown, JSON, or text in a “field name: value” format.
The original data might look like this:
| age | plan | spend_90d | churn | |---:|:---:|---:|:---:| | 31 | B | 1260.5 | 0 |
Once fed into the model, it becomes a sequence resembling:
age: 31, plan: B, spend_90d: 1260.5, churn: 0
To a person, the two forms mean roughly the same thing. To a model, however, the change is substantial.
Tables naturally have a clear two-dimensional structure: columns represent variables, rows represent samples, and values in the same column usually share a data type and statistical meaning. Text sequences lack these strong constraints. The model must infer again, from commas, line breaks, and field names, which values belong to the same row and which fields can be compared.
More problematically, many tabular tasks should be insensitive to column order. Placing “age” in the first column or the fifth should not change the prediction. But LLMs use positional encodings, so rearranging the same content may change its internal representation. A prompt can instruct the model to ignore order, but it cannot provide true column-permutation invariance at the architectural level.
Traditional tree models, by contrast, naturally split on features. They do not care which column comes first in a CSV file; they care only whether splitting on a particular field reduces the loss. This is precisely the difference in inductive bias: Tree models treat tables as tables. LLMs first disguise tables as prose and then try to reconstruct the structure.
To an LLM, Numbers Do Not Form a Continuous Number Line
Numeric tokenization is another critical obstacle.
To a model designed specifically for numerical data, 12.6 and 12.7 are two nearby real numbers. In a general-purpose language model, however, they are first treated as strings and may be split into different token combinations. The fact that a model knows “100 is greater than 10” does not mean its internal representations inherently preserve continuity, monotonicity, and scale relationships.
This distinction is especially important near decision boundaries. For example, credit risk may change sharply around a debt-to-income ratio of 0.35, while industrial failure rates may rise rapidly once temperature crosses a certain threshold. Tree models can directly learn split points, linear models can learn coefficients, and specialized numerical networks can use encodings designed for continuous variables.
An LLM, by contrast, must perform three tasks at once:
- Recover numeric values from character tokens;
- Determine the relative magnitude and distance between different values;
- Learn their statistical relationships with the label.
If the input also mixes dates, percentages, currency symbols, missing values, and scientific notation, the difficulty increases further. To a business system, 1,200, 1200.0, and 1.2e3 may represent the same number, but to a token sequence they are different surface forms.
This also explains why LLMs may appear increasingly capable at elementary arithmetic yet still fail at large-scale numerical prediction. The former can be improved through reasoning traces, tool use, or training examples. The latter requires the model to learn precise, repeatable statistical boundaries across tens or hundreds of thousands of records.
The Training Objective Was Misaligned from the Start
The core pretraining objective of a general-purpose LLM is typically next-token prediction. Vast quantities of internet text allow it to learn grammar, knowledge, code patterns, and linguistic reasoning, but do not require it to become an excellent tabular classifier.
Tabular prediction optimizes a different class of objectives: cross-entropy, mean squared error, ranking loss, survival analysis loss, or objective functions designed directly around business costs. The model must repeatedly update its parameters using labels from the training set to find the decision boundary that works best for the current data distribution.
Putting dozens of examples into a prompt is fundamentally a form of in-context learning, not fitting in the conventional sense. In-context learning can indeed help an LLM imitate a task format and may allow it to use priors acquired during pretraining for zero-shot judgments, but it cannot serve as an equivalent replacement for full training on hundreds of thousands of rows.
A longer context window does not imply sufficiently efficient use of samples. Once serialized, a table with 100,000 rows may consume millions of tokens or more, and resending all of them for every prediction is clearly uneconomical. If only a few dozen rows are sampled as examples, the model sees merely a slice of the distribution, making it easy to miss long-tail classes, rare combinations, and temporal drift.
This leads to a somewhat counterintuitive result: An LLM with billions of parameters may lose to a gradient-boosted tree trained on a single CPU in a matter of minutes. This is not because the latter is “smarter,” but because its objective, input representation, and task are fully aligned.
Language Priors Sometimes Help—and Sometimes Contaminate Predictions
LLMs are not entirely without advantages when processing tables. If column names have clear semantics, such as “past due,” “occupation category,” or “number of complaints in the past year,” the model can draw on its pretrained knowledge to quickly understand what the fields may represent. When samples are scarce and field descriptions are detailed, such semantic priors may even outperform a small model trained from scratch.
The problem is that those priors may not match the current data.
For example, based on common sense, a model may assume that high-income users are less likely to churn. But data from a specific product may show that high-income users are more likely to switch to a competitor. A traditional supervised model will follow the training data, while an LLM may waver between the evidence in the data and linguistic common sense.
Field names can also be misleading. An internal company field called risk_level may not be the true risk label, but merely an intermediate variable generated by a legacy rule. active_days might mean the number of active days in the past 30 days, or it might mean the cumulative number of days the account has been active. An LLM will proactively fill in the semantics, but this apparent helpfulness can become a source of bias in statistical modeling.
Label leakage is even more dangerous. If a column name hints at the prediction target, an LLM may guess the answer directly from its semantics. Once the field is renamed or the model is deployed in a real production environment, performance may drop rapidly. Therefore, evaluating an LLM’s tabular capabilities requires more than randomly splitting a few rows of data. It should also test:
- Whether performance declines after column names are anonymized;
- Whether outputs remain stable when column order is changed;
- Whether results remain consistent when numeric formats change;
- Whether the model generalizes to different periods, regions, or business lines;
- Whether the conclusions still hold after suspected leakage fields are removed.
Without these tests, impressive benchmark results may be measuring linguistic memory, field semantics, or data contamination rather than genuine tabular learning ability.
Probability Outputs Are Not Necessarily Reliable Probabilities
In risk control, healthcare, marketing, and operations, businesses usually need more than a class label—they need a usable probability.
If an LLM says, “This user has an 80% probability of churning,” that does not mean the 80% figure has been calibrated. It may simply be a number that sounds plausible in generated language. Even when scores are obtained through log probabilities or constrained output tokens, their reliability still needs to be evaluated on an independent validation set.
If a well-calibrated model assigns a risk score of 0.8 to 100 samples, then over time, approximately 80 of those events should actually occur. This property directly affects threshold decisions, cost estimates, and the allocation of human review resources.
Tree models can also be poorly calibrated, but they can be corrected using methods such as Platt scaling or isotonic regression, and their output pipelines are relatively deterministic. LLM results are also affected by prompts, sampling parameters, model versions, and server-side updates. Setting temperature to 0 can reduce randomness, but it cannot automatically make the probabilities trustworthy.
Stable generation does not imply statistical calibration. This is one of the layers developers most easily overlook when integrating large models.
Cost and Latency Make the Problem Even More Practical
Suppose a system needs to process 10 million transaction records per day. A gradient-boosted tree can perform batched, vectorized inference with low per-record cost and predictable latency. Serializing every row and sending it to an LLM one request at a time would not only incur substantial token costs, but also introduce network latency, rate limits, retries, model-version drift, and data-compliance concerns.
Tabular tasks also typically require high throughput and strict reproducibility: The same input should produce the same result during an audit, and replay comparisons should be possible before and after a model upgrade. Probabilistic generation services are not inherently designed for these requirements.
This means that even if an LLM matches a traditional model on a small benchmark, it may not be the better choice in production. Engineering decisions must compare complete systems:
- Total training and inference costs;
- P95 and P99 latency;
- Handling of missing values and outliers;
- Probability calibration;
- Interpretability and auditability;
- Data drift monitoring;
- Version pinning and rollback capabilities.
Comparing only an accuracy table is usually insufficient.
The Right Approach Is Not Either-Or, but Letting Each Model Do What It Does Best
LLMs remain highly valuable in tabular workflows, but they should not be assumed to serve as the final predictor. A layered architecture is more appropriate.
1. Let the LLM Handle Understanding and the Traditional Model Handle Prediction
An LLM can read data dictionaries, business documents, and field descriptions to help identify potential leakage, recommend feature transformations, and generate exploratory analysis code. The actual classification or regression can then be handled by CatBoost, LightGBM, or a specialized tabular model.
Even a minimal baseline does not require a complex design:
from catboost import CatBoostClassifier

model = CatBoostClassifier(
    iterations=800,
    depth=8,
    learning_rate=0.05,
    loss_function="Logloss",
    eval_metric="AUC",
    verbose=False
)

model.fit(
    X_train,
    y_train,
    cat_features=category_columns,
    eval_set=(X_valid, y_valid),
    early_stopping_rounds=80
)

risk_score = model.predict_proba(X_test)[:, 1]
This code is not flashy, but it provides a baseline that must be beaten. Any LLM-based solution should be compared against it using the same data split, the same metrics, and the same cost accounting.
2. Turn Unstructured Information into Features
Many enterprise datasets are not purely tabular. Customer service records, clinical notes, support tickets, and contract clauses contain important signals. In such cases, an LLM or text embedding model can extract semantic features, which can then be combined with numerical and categorical features to train a downstream model.
For example:
Customer service conversation → topic, sentiment, complaint reason, or vector representation → concatenate with user behavior features → tabular model predicts churn
This approach preserves the LLM’s strengths in natural language while avoiding the need for it to directly handle the final high-frequency decision that requires rigorous calibration.
3. Let the LLM Handle Low-Frequency Exceptions and the Rules System Handle the Main Workflow
The same logic applies to invoice, contract, and form automation. Common templates can be processed with OCR, rules, or specialized parsers. When the system encounters a new supplier, an ambiguous field, or an unusual layout, it can invoke an LLM for semantic interpretation. The output should still undergo type validation, range checks, and human review where necessary.
LLMs are well suited to answering, “What does this content mean?” They are not suited to independently guaranteeing that “not a single one of these ten thousand amount fields may be wrong.”
4. If You Do Use an LLM, Rigorous Evaluation Is Essential
If the task has very few samples, field semantics are especially important, or the goal is to test a foundation model’s in-context learning capability, an LLM may be worth trying. At a minimum, however, you should:
- Establish baselines using logistic regression, CatBoost, and LightGBM;
- Use temporal splits or entity-grouped splits to avoid leakage from random partitioning;
- Fix the prompt, sampling parameters, and model version;
- Report accuracy, recall, AUC, calibration error, and cost separately;
- Test perturbations involving column order, field renaming, unit changes, and missing values;
- Do not allow the model to freely generate probabilities unless they have been externally calibrated;
- Retain rule-based constraints and human review for high-risk decisions.
Will Large Tabular Models Be the Answer?
Foundation models trained specifically for structured data are becoming more common. They attempt to learn transferable capabilities across tables from large collections of datasets while using specialized representations for numerical values, categories, missing values, and relationships between columns. The direction makes sense: If the success of language models comes from large-scale pretraining, the tabular domain may likewise produce transferable foundation models.
However, tabular data is more fragmented than text. Field semantics, units, sampling processes, and label definitions vary greatly across organizations. Fields with the same name may mean different things, while fields with different names may express the same concept. Public internet text can form a relatively unified language distribution, but enterprise tables are often divided by permissions, privacy constraints, and business boundaries.
Large tabular models are therefore worth watching, but they will not eliminate the value of traditional machine learning in the near term. In particular, for medium-scale datasets with clear labels and stable features, gradient-boosted trees remain an exceptionally difficult engineering baseline to beat.
Final Assessment: Do Not Confuse Generality with Task Optimality
The greatest value of LLMs lies in providing a unified, natural interface. They allow developers to describe tasks in language and connect text understanding, code generation, and tool use. This generality is powerful, but being general-purpose does not mean being optimal for every data modality.
Tabular prediction requires preservation of structure, sensitivity to numerical values, sample efficiency, calibratable probabilities, and low-cost batch inference. These happen to be areas in which general-purpose LLMs are not inherently strong.
For development teams, the more practical conclusion is not that “LLMs should never touch tables,” but rather these three principles:
- Let LLMs explain tables; do not assume they should replace tabular models;
- Let LLMs extract signals from unstructured data, then pass those signals to a calibratable predictor;
- Establish an inexpensive, stable traditional baseline before discussing whether a large model delivers real gains.
There is no shame in a model with hundreds of billions of parameters failing to consistently beat CatBoost. What is truly problematic is when a team skips baselines, calibration, and data leakage checks simply because it is called a “large model,” then treats a plausible-looking response as a prediction system.
Tabular prediction is not a conversation. Ultimately, the quality of a solution is determined not by whether the model can explain its answer, but by whether it is accurate, stable, and inexpensive on unseen data—and whether it can withstand replay testing and audits.
References
- Why Large Language Models Fail at Tabular Prediction: The index page for a paper released in August 2026 that discusses the systematic capability limits of general-purpose large language models on tabular prediction tasks.