Microsoft Lets AI Diagnose Windows Slowdowns for You

Microsoft is testing the use of MCP to feed Windows performance trace data to GitHub Copilot for analysis, allowing developers to diagnose CPU, disk, memory, and driver issues using natural language. It won’t replace performance engineers, but it could significantly shorten the troubleshooting process.
Microsoft Is Letting AI Diagnose Windows Slowdowns for You
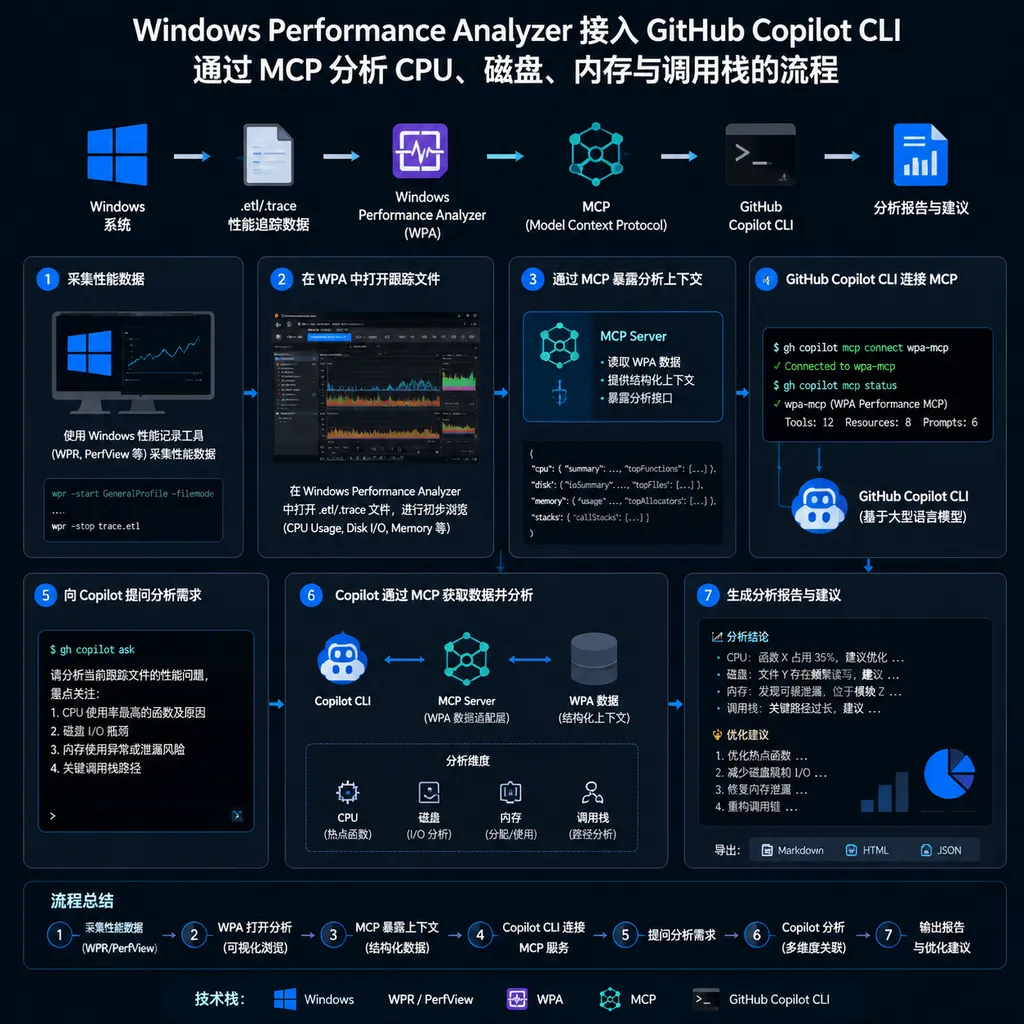
Microsoft is testing AI integration for Windows Performance Analyzer (WPA). After enabling WPA MCP, developers can ask questions directly through the GitHub Copilot CLI, such as “Why did CPU usage suddenly hit 100%?”, “Which process is continuously using the disk?”, or “Was this performance regression caused by a driver?” The AI reads performance trace data and generates a root-cause analysis and summary.
The test came to light on August 5, and Microsoft has already been using it internally to investigate Windows performance issues. Based on the information disclosed so far, it is primarily intended for Microsoft engineers, third-party application and driver developers, and OEMs. Microsoft has not yet announced a general release date, supported versions, or licensing terms for all developers.
This is not simply a chat box placed next to Task Manager. It is Microsoft’s first attempt to expose Windows’ low-level performance diagnostics to AI agents in the form of MCP tools.
What Makes WPA Difficult Is Not Too Little Data, but Too Much
WPA is one of the most important analysis tools in the Windows Performance Toolkit. It typically reads trace files captured by Windows Performance Recorder and displays information such as processes, threads, CPU activity, call stacks, disk I/O, memory, paging, and scheduling behavior.
If a Windows 11 PC experiences random stuttering, the traditional troubleshooting process might look like this:
- Record a performance trace covering the period before and after the issue occurs;
- Identify the time interval corresponding to the slowdown in WPA;
- Examine CPU usage, context switches, and thread scheduling;
- Expand processes, threads, and call stacks to locate abnormal hotspots;
- Compare them against disk activity, hard page faults, and memory pressure;
- Determine whether the issue comes from application code, a system service, a filter driver, or hardware;
- Filter and aggregate the data again based on a new hypothesis.
The tool presents the evidence, but it does not directly tell developers which table they should examine. With a very large trace file, the most time-consuming part is often not opening WPA, but establishing the right path for the analysis.
For example, “slow application startup” can have many possible causes: the main thread may be performing synchronous I/O, antivirus software may be scanning new files, a driver may be slow to respond, system memory pressure may be causing paging, or a background process may be consuming CPU time. To users, all of these look like “I clicked the icon and nothing happened for ages,” but in WPA they are scattered across different data views and call stacks.
Performance engineers can quickly narrow the scope based on experience, while ordinary application developers can easily get lost in the charts. This is precisely where AI integration offers the most value.
MCP Provides the Tools, While the Model Organizes the Investigation
MCP, or Model Context Protocol, is an open-source model context protocol originally developed by Anthropic. It is often compared to USB-C for AI applications: instead of requiring the model to use a separate proprietary interface for every external tool, it can discover tools, read resources, and perform operations through a relatively standardized protocol.
In the context of WPA, MCP’s core value is not enabling the model to “understand screenshots,” but exposing structured performance data and analysis operations to the agent. Based on the question, the model can invoke the appropriate tools to query a specified time window, process, thread, call stack, or resource activity, then connect the results into a readable chain of cause and effect.
Conceptually, the interaction might look something like this. The following is only an illustration of the analysis workflow, not official command syntax published by Microsoft:
Developer: Analyze why the application was unresponsive between 14.2 and 18.5 seconds.

Agent:
1. Check the state of the target process's main thread;
2. Query CPU scheduling and disk activity within the same time window;
3. Expand the call stack with the longest wait time;
4. Compare against memory pressure, paging, and driver activity;
5. Output the primary evidence, possible root cause, and items requiring verification.
Previously, developers first needed to know which views were available in WPA, how to configure filters, and how to expand call stacks. Now they can begin by describing the symptom in business terms and let the agent perform the initial investigation.
The difference between these two workflows is somewhat like moving from “manually writing SQL to query logs” to “first telling an analysis assistant what you want to verify.” The underlying data remains unchanged, but the barrier to querying it and the cost of trial and error are reduced.
It Is Best Suited to Three Types of Performance Problems
Based on the use cases disclosed by Microsoft, WPA’s AI integration will cover at least the following scenarios.
1. Locating Performance Regressions
After an application update, cold-start time increases from 1.8 seconds to 3 seconds. Developers would normally need to compare traces from the old and new versions to determine whether the additional time was spent on CPU computation, file reads, module loading, or thread waits.
AI can first generate a summary of the differences, highlighting new hotspots and abnormal call paths. For teams that run large numbers of performance benchmarks every day, this is more useful than a report that merely says “30% slower,” because it takes the alert one step closer to root-cause analysis.
2. Intermittent Stuttering and Input Latency
Intermittent issues are the hardest to investigate. They may occur only on certain devices, with specific driver versions, or when the system is under memory pressure, making them difficult for developers to reproduce reliably.
If a performance trace was captured when the issue occurred, the agent can examine whether threads were preempted around the time of the slowdown, what resources the main thread was waiting for, whether the disk queue suddenly grew, and whether driver execution was abnormal. It may not reach the correct conclusion on the first attempt, but it can narrow dozens of possible directions down to two or three.
3. Attributing Cross-Layer Problems
Windows performance issues often cross the boundaries between applications, runtimes, the operating system, drivers, and hardware. Application teams see API timeouts, OEMs see the entire machine becoming less responsive, and driver teams may focus only on a particular segment of device activity.
A unified summary generated by AI could reduce the cost of passing screenshots and tables back and forth between teams. For OEMs and driver developers in particular, being able to ask directly whether an issue was caused by paging, disk activity, or a driver is more efficient than explaining every column of WPA data from scratch.
The Real Improvement Is “Fewer Wrong Turns,” Not Automatically Fixing Your PC
This capability is promising, but it should not be interpreted as Windows already having a fully automated performance doctor.
First, the model analyzes trace data; it does not inherently possess the ground truth about the system. If the required events were not enabled during capture, call stacks are missing, or the issue did not occur within the recording window, the AI will likewise be unable to determine the cause. Performance analysis still follows the principle that “capture quality sets the upper limit on the quality of the conclusion.”
Second, correlation does not equal causation. If a process happens to consume a large amount of CPU when a slowdown occurs, that does not necessarily mean it is the root cause. Increased disk activity may also simply be the result of an upstream operation. If the model turns temporal overlap directly into a causal conclusion, it creates a false sense of certainty that can be more dangerous than human misjudgment.
Third, call stacks, process names, file paths, and device information may all contain sensitive content. Before handing trace data to a cloud-based model, enterprises need to determine whether the data is uploaded, how long it is retained, whether it can be processed locally, and which resources the MCP server exposes. MCP standardizes connectivity; it does not automatically solve permission, privacy, or auditing issues.
A trustworthy output therefore should not consist solely of a sentence such as “a certain driver caused the slowdown.” It should include:
- The time interval used for the analysis;
- The processes, threads, and call stacks involved;
- Supporting evidence from CPU, disk, memory, or scheduling data;
- The confidence level of the conclusion;
- Alternative explanations that still require human verification;
- Recommended additional events to capture or reproduction experiments to run.
If Microsoft ultimately provides only a polished natural-language summary, its value will be limited. It will truly become part of the engineering workflow only if it can consistently provide a clickable, reviewable chain of evidence.
Microsoft Is Turning Windows Into a Tool Platform for Agents
WPA’s MCP integration is not an isolated project. Microsoft has previously announced plans to advance native MCP support in Windows and design a device-side discovery and registration mechanism for Agent Connectors, enabling AI agents to connect to local applications and external services in a more standardized way.
This direction is more important than “putting a Copilot into every Windows application.”
A chat box can only answer questions, while a tool protocol gives agents the opportunity to access real context and perform analysis. File management, system settings, development tools, and performance diagnostics can all essentially be packaged as different MCP servers. The model is responsible for understanding intent and breaking down tasks, while Windows handles permissions, discovery, invocation, and auditing.
WPA is a well-suited testing ground: its data is highly structured, its problems are specialized and time-consuming, and its analysis results can be reviewed by engineers. Compared with allowing an agent to modify the registry or operate the desktop directly, reading performance traces poses less risk and offers a clearer return on investment.
Compared with Linux’s perf and eBPF toolchains or Instruments on macOS, none of these platforms lacks low-level observability. What they lack is an intermediate layer that converts data into conclusions developers can act on. Microsoft is now betting that large language models can perform this role, while MCP can prevent every diagnostic tool from having to build its own model interface from scratch.
Useful for Developers, but Do Not Remove the Experts From the Group Chat Just Yet
Our assessment is that integrating AI into WPA is one of the few system-tool use cases genuinely well suited to agents.
The problem it solves is not “whether a performance chart can be drawn,” but “what should be investigated next?” For application developers who do not use WPA regularly, AI can lower the barrier to entry. For experienced performance engineers, it can handle initial triage, comparisons, and report preparation, leaving them more time for complex causal verification.
However, it will not replace performance experts in the short term. High-quality performance analysis depends on knowledge of system architecture, hardware behavior, business context, and experimental design—and not all of that information is necessarily present in a single trace. An agent can quickly identify anomalies, but it may not know whether those anomalies are reasonable in a particular product.
A more realistic role is for AI to serve as a “junior performance analyst”: it first reads through massive traces and lists the evidence and hypotheses; senior engineers then decide which conclusions are credible and how to design the next experiment.
At the same time, Microsoft is also optimizing memory usage in Windows 11 and its applications, with the aim of improving performance on devices with 8 GB of RAM or more. However, this and WPA’s AI analysis represent two different approaches: the former directly reduces system resource consumption, while the latter improves the efficiency of finding problems. AI can help explain why a computer is slow, but it cannot replace the operating system’s responsibility to manage memory and scheduling properly.
As of August 6, Microsoft had not disclosed a public testing channel or official release date for WPA MCP. The more important questions going forward are not whether it can answer “Why did it get slower?”, but whether it can meet three engineering criteria: Can its conclusions be reproduced? Can its evidence be traced? Can incorrect recommendations be identified promptly?
If it cannot meet these criteria, it will merely be a talking commentator for complex charts. If it can, the workflow for troubleshooting Windows performance could genuinely be rewritten.
References
- ITHome: Microsoft Tests AI Integration for Its Windows 11 Performance Analysis Tool to Identify the Root Causes of App Slowdowns—Covers WPA’s integration with the GitHub Copilot CLI through MCP, Microsoft’s internal testing, and the primary performance-analysis scenarios.