
AI Recalculates the World’s Glacier Inventory
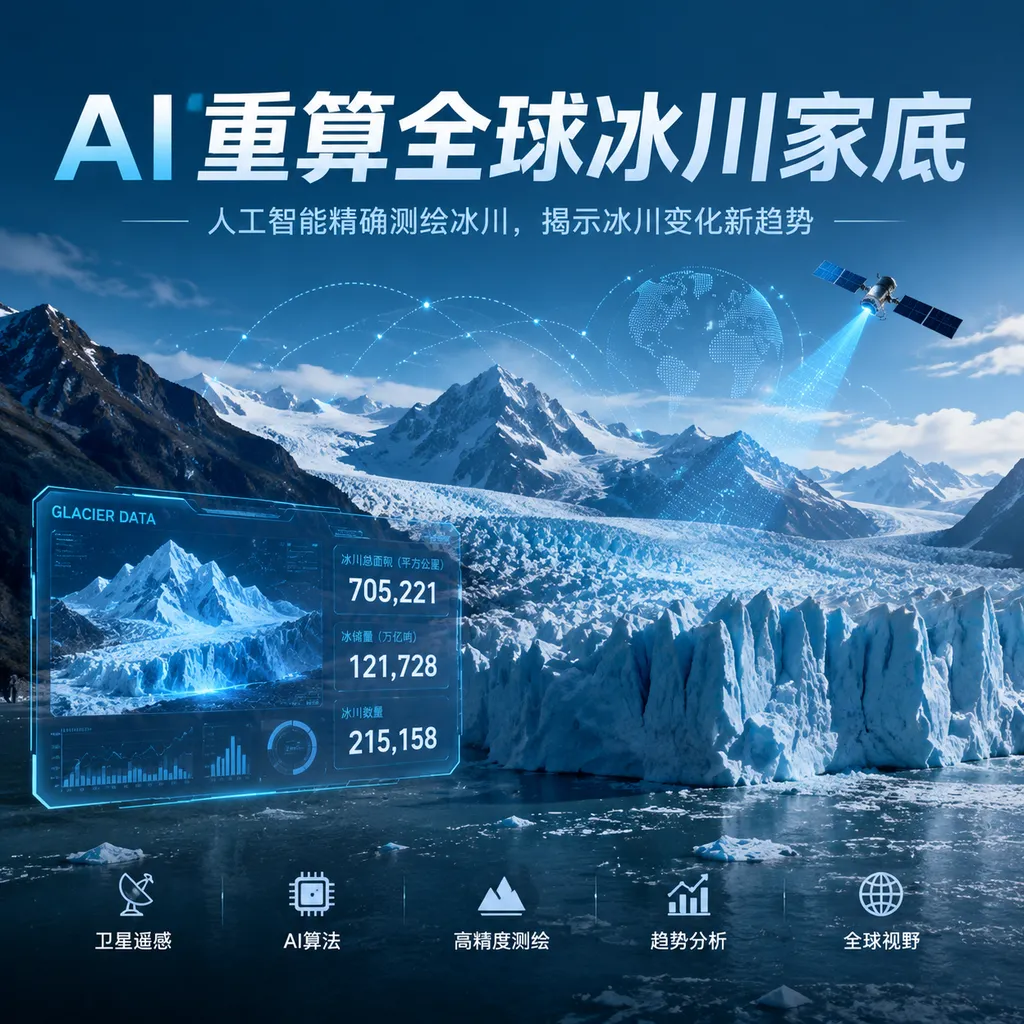
IceBoost v2.0 reconstructs global glacier thickness using more than 7 million field measurements, estimating total ice volume at approximately 150,000 cubic kilometers and mapping individual glaciers up to 40% more accurately than existing methods.
How Much Ice Is Stored in the World’s Glaciers? AI Offers a New Answer
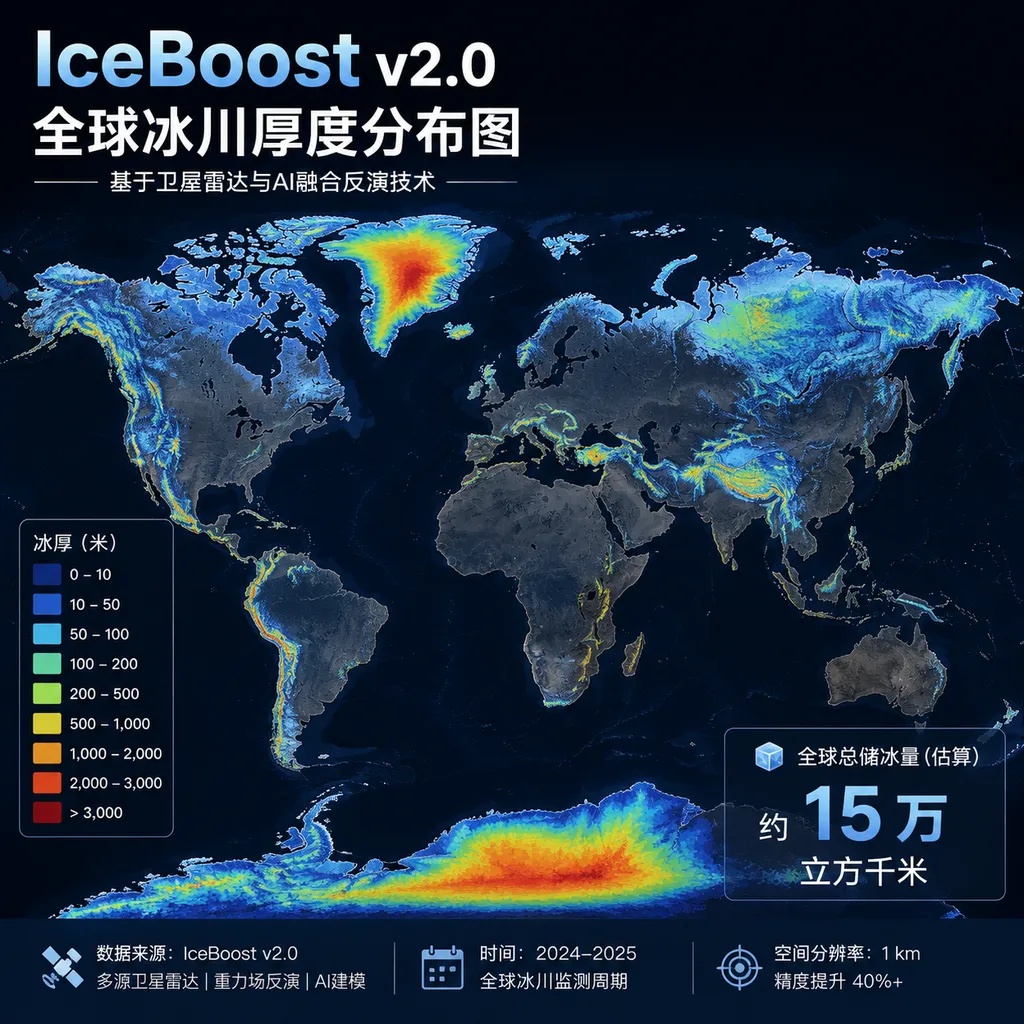
Today (August 8), IceBoost v2.0—developed under the leadership of Ca’ Foscari University of Venice, with participation from the Institute of Polar Sciences of Italy’s National Research Council—released a new estimate of global glacier ice reserves. Excluding the Antarctic and Greenland ice sheets, the world’s glaciers store approximately 150,000 cubic kilometers of ice. If all of this ice were to melt, it could raise global mean sea level by approximately 32.3 centimeters.
These two figures do not completely overturn previous global estimates. The real value of IceBoost v2.0 lies in breaking down the question of “how much ice exists worldwide” into more detailed questions: “Where is the ice within each glacier, how thick is it, and what might the underlying bed look like?” According to the research team, the new model’s representation of the spatial distribution of glacier ice more closely matches field observations, improving agreement by as much as 40% over existing methods in some regions.
In other words, this update does not simply replace one estimate of the global total with another. It redraws a more detailed, more topographically realistic three-dimensional inventory of the world’s glaciers.
It Is Not a Conversational Large Model, but an Ensemble of Gradient-Boosted Trees
Although the project is described as an “AI model,” IceBoost v2.0 has little in common with generative large models such as GPT and Claude. It addresses a typical supervised regression problem: given the topographic, dynamic, and climatic features of a location on a glacier, it predicts the thickness of the ice at that point.
Publicly available information shows that IceBoost v2.0 is built around two gradient-boosted decision-tree models: XGBoost and CatBoost. Both are trained using L2 loss, and their final predictions are averaged with equal weighting. This combination has no mysterious “emergent capabilities,” but it is well suited to the tabular, heterogeneous, multi-source data common in Earth science.
The model was trained on more than 7 million glacier ice-thickness measurements worldwide and incorporates 26 physical and geometric variables, including:
- Terrain slope and curvature;
- Glacier surface elevation and surrounding topography;
- Ice-flow velocity;
- Climatic variables such as temperature;
- Glacier geometry and spatial relationships.
The model predicts ice thickness at individual spatial points, then combines large numbers of point-level predictions into a thickness distribution for each glacier and integrates them to calculate glacier volume. It covers ice bodies included in global glacier inventories and can be deployed on updated versions of the Randolph Glacier Inventory.
One point can easily cause confusion: the study excludes the main Antarctic and Greenland ice sheets, but it does not remove all peripheral mountain glaciers on Greenland. Independent glaciers outside the main ice sheet, such as those on the Geikie Plateau in East Greenland, may therefore still be included in the inventory and the model’s analysis.
Why Measuring Ice Thickness Is Much Harder Than It Looks
The outlines of glacier surfaces can be obtained from satellite imagery, but ordinary optical images cannot directly reveal the location of the bedrock beneath the ice. Actual measurements generally require airborne or ground-based ice-penetrating radar, seismic methods, and other geophysical techniques. The equipment is expensive, the environment is harsh, and the number of glaciers is enormous. It is therefore impossible to survey every glacier in the world at the same density.
This has created a longstanding problem: we know relatively much about glacier area, but far less about ice thickness and subglacial topography.
Traditional global estimates often infer how thick a glacier “should be” based on glacier area, surface slope, mass conservation, or relationships derived from ice-flow dynamics. These methods have a clear physical basis, but in complex valleys, tributary junctions, glacier tongues, or unusual terrain, simplified assumptions can easily smooth out local variations in thickness.
IceBoost v2.0 takes an approach more akin to filling in the gaps between existing radar observations and survey lines around the world. It learns from millions of observations what range of ice thickness typically corresponds to a particular combination of slope, curvature, flow velocity, temperature, and geometry. It then extends these statistical relationships to glacier regions that lack direct observations.
This is also where gradient-boosted trees have an advantage for this task. Compared with deep neural networks that require highly standardized inputs, tree-based models are better suited to numerical features, nonlinear relationships, and variables measured at different scales. They also make it easier to analyze which variables are driving the predictions. Combining XGBoost and CatBoost with equal weighting can also reduce, to some extent, the bias introduced by relying on a single model architecture.
However, one point must be made clear: using physical variables as inputs does not mean the model inherently obeys every law of physics. IceBoost v2.0 is still fundamentally a data-driven regressor. It is generally more reliable in regions with abundant observations and landforms similar to those represented in the training set. In sparsely measured areas or places with extreme terrain, its extrapolations may still fail.
150,000 Cubic Kilometers Is Not a Prediction of Melting This Century
The statement that the ice “could raise sea level by 32.3 centimeters” can easily be read as a disaster forecast with a specific timeline. In reality, it is a sea-level equivalent: a theoretical result obtained by assuming that the entire currently estimated volume of glacier ice melts and then distributing that water across the surface area of the world’s oceans.
It does not mean that all this ice will disappear by 2100, nor does it specify a particular year by which it will melt. The actual amount of future sea-level rise will also depend on greenhouse gas emissions, temperature, precipitation, glacier dynamics, ocean thermal expansion, and changes in the Antarctic and Greenland ice sheets.
Moreover, the 32.3-centimeter figure explicitly excludes the two major ice sheets. The Antarctic and Greenland ice sheets account for the largest share of long-term sea-level risk, so IceBoost’s result should not be interpreted as representing all land-based ice reserves.
A more accurate interpretation is that IceBoost v2.0 updates the “initial inventory” used in subsequent simulations. Before a climate model can calculate how much of a glacier will remain by 2100, it must first know how thick the glacier is today. If the initial volume is wrong, then even under exactly the same warming scenario, estimates of melting rates, peak runoff, and sea-level contribution will remain biased throughout the simulation.
Similar Global Totals Can Conceal Major Local Differences
The new study’s estimate of the global total is broadly consistent with previous research, but global averages can obscure enormous regional differences.
One representative example cited by the research team is the Geikie Plateau in East Greenland. IceBoost v2.0 suggests that parts of the region’s glaciers may be approximately 2 kilometers thick, with regional ice reserves close to twice the previously reported amount. This does not mean that the global ice total should also double. Rather, it suggests that older methods may have put the ice in the wrong places: overestimating some regions and underestimating others, with the errors coincidentally canceling each other out when summed globally.
Such errors may not stand out in estimates of total sea-level contribution, but they can be decisive for regional water resources and glacier dynamics.
Areas of thick ice often have longer response times, while subglacial topography affects ice-flow velocity, how tributaries merge, and the paths along which glaciers retreat. If a glacier bed contains a deep trough, the glacier may look similar on the surface to an ordinary valley glacier while having a completely different ice volume and future trajectory. Assigning each glacier only an average thickness is like knowing how much concrete was used in a building without knowing where the load-bearing walls are—the total may be correct, but the structural analysis can still be wrong.
The claim of an “improvement of up to 40%” also requires careful interpretation. It refers to the model’s greatest improvement in comparisons with field observations in certain areas. It should not be presented as meaning that every glacier worldwide is now modeled 40% more accurately, nor does it imply that all prediction errors have been reduced to negligible levels. The regional generalizability of a scientific model must ultimately be validated through additional independent survey lines and future model versions.
The Most Important Application May Not Be Sea Level
Sea-level rise makes the most eye-catching headline, but for many inland regions, the more immediate value of IceBoost v2.0 lies in freshwater management.
Glaciers function as natural reservoirs: they accumulate snow and ice during winter and colder years, then steadily release meltwater during warmer seasons. The research team notes that glacier-fed water supplies affect approximately 1.9 billion people worldwide, supporting river ecosystems, agricultural irrigation, hydropower generation, and community drinking water.
During the early stages of warming, accelerated glacier melting may temporarily increase runoff. Once the ice mass shrinks beyond a certain point, however, meltwater passes the point of “peak water” and then declines continuously. Determining when a particular basin will cross this threshold requires more than knowing glacier area. It also requires knowing how much ice the glacier actually contains and how that ice is distributed across different elevations and slopes.
This is especially important for parts of South America that are becoming increasingly arid and desertified. If regional models underestimate deep ice bodies, they may predict water-source depletion too early. If they overestimate reserves, they may create a false sense of security for agriculture, urban water supplies, and power systems.
IceBoost v2.0 is expected to be used by GlacierMIP4 researchers as a representation of the present-day state of glaciers, feeding into the next generation of global glacier simulations and supporting IPCC assessments of glacier evolution. Its role is not to replace climate models, but to provide them with a more reliable starting point.
This Kind of AI Is More Practical Than “Replacing Scientists”
IceBoost v2.0 demonstrates a more credible use of AI in science: rather than generating plausible-sounding explanations, it fills the spatial gaps between expensive observations.
It has not solved every problem in glaciology. Seven million measurements may sound like a lot, but coverage remains highly uneven when spread across the world’s vast number and area of glaciers. Data collected in different periods and with different instruments may also contain systematic biases. The model must additionally contend with updated glacier boundaries, mismatched scales among climate variables, and training data that cannot represent every form of extreme terrain.
IceBoost v2.0 is therefore best treated not as the definitive answer to the “true thickness” of the world’s glaciers, but as a higher-quality, consistently calculated global baseline. It can help researchers identify anomalous regions where additional measurements would be most valuable, while also allowing different climate scenarios to use the same initial ice-volume dataset.
From an engineering perspective, the significance of this release is also clear: AI has not replaced radar observations; instead, it has amplified limited radar data into a globally usable data product. Observations provide the anchors, physical and geometric variables supply the context, and machine learning handles interpolation and generalization between them.
This is far less flashy than asking a large model to write a climate report, but it may come much closer to the genuine value that AI can add to scientific research.
References
- ITHome: New AI Estimates That the World’s Glaciers Contain Approximately 150,000 Cubic Kilometers of Ice — Introduces IceBoost v2.0’s training data, estimate of global glacier ice reserves, sea-level equivalent, and research applications. The paper was published in Scientific Data in 2026, DOI: 10.1038/s41597-026-07744-9.